Caution! Malicious actors have impersonated Combustible in fraudulent job offers. Combustible never requires sensitive personal data or payment during its recruitment process; all our offers are exclusively posted on our official job site for your safety. If you have been targeted by this fraud, please report it here.

Improve Your Google Analytics Skills With These 5 Hacks

Google Analytics is a fantastic tool and is by far the most popular one to analyze web performances. But the tool itself is not sufficient to provide you with the insights you need. While there are a lot of articles about how to use the tool, the following article aims at giving you 5 real-life examples on how to use Analytics in very specific situations. Let’s dive right in.


Case Study 1: Analyzing a redesign performance

Here’s an Analytics screenshot of a site redesign we did for a client. We launched the site about 4 weeks ago (see the red arrow). Looking at the chart quickly, would you say the redesign is doing well or not?

drop-in-traffic

Most clients would look at this and be very worried… And to be honest, so were we at first! So I decided to dig in to find a reasonable explanation.

The first thing we’ll do here is to compare the days that followed the redesign with the days that preceded it, just like this:

drop-compared

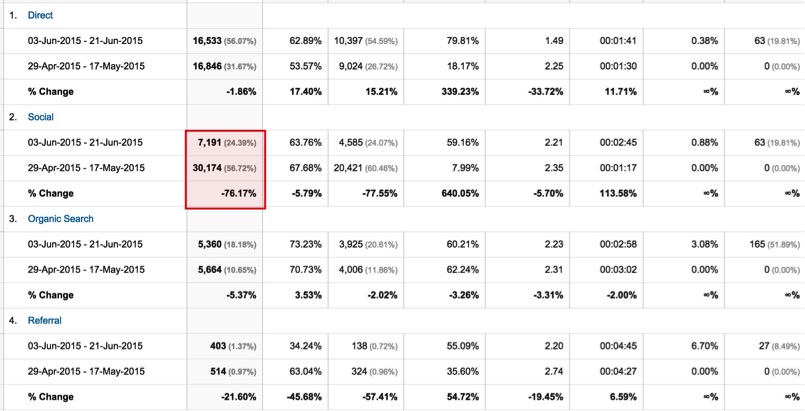
The overall drop in traffic is close to 45%, which is a lot. But we need to keep in mind that this is an aggregate traffic view. To better understand what’s happening, we need to drill further and look at a breakdown by traffic sources. Here’s the same view when we individualize each traffic source:
drop-compared

As you can see, most of the traffic sources are down just by a few percentage points (which is normal when launching a new site, especially for organic traffic), but the social traffic is WAY down.

When I found out about this, we asked the client if they had changed anything in their social media activities. They told us they had a big campaign that had just come to an end a few weeks earlier.. So it turned out the big drop in traffic wasn’t due to the redesign.. Hence the importance to analyze the data far beyond the numbers you see and to contextualize them.


Case Study 2: Analyzing the conversion rate when no goal is defined

Quite often, we will work on a site that has no goal-tracking history in Google Analytics. This makes it really hard to analyze past versus new performances when we launch a new site.

But sometimes, you can still get an idea of past performances by looking for some kind of “thank you” pages from the previous site. For example, imagine the main goal of a client is to generate leads through a contact form. If you’re lucky, the form will have a “thank you” page instead of an Ajax “thank you” message.

In this case, you just need to find the “thank you” page by looking into the All pages report. In the filter, just try variations of “thank-you, confirmed, complete, checkout” and the likes and you might find a “thank you” page that you can use to calculate the previous conversion rate.

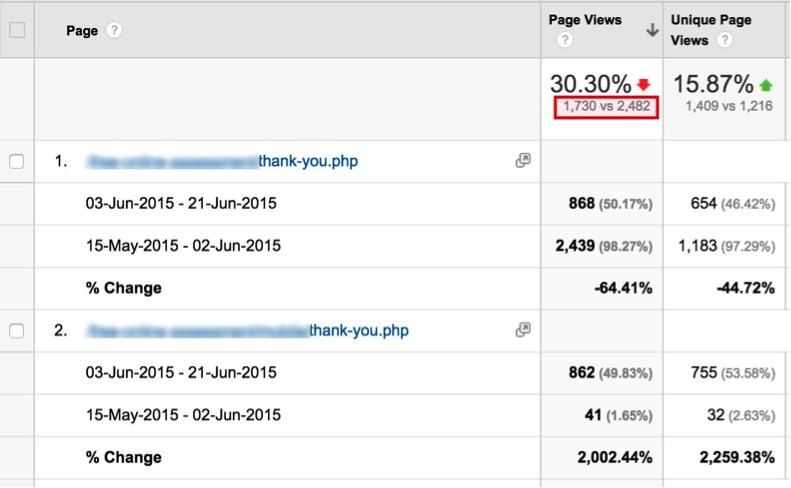
Here’s an example from one of our clients’ site. We were able to find the old “thank you” page in Analytics so that we could compare the new site’s performances. Here’s the before and after screenshot:
drop-compared

Now you only need to take the total amount of “thank you” page views and divide it by the total number of visits in order to get the conversion rate. For example, the previous period had 43,834 visits and 2,482 thank you page views, so (2,482 / 43,834) = 5.66% conversion rate.

The new version of the site had 29,487, so (1,730 / 29,487) = 5.87%. That’s how you can compare previous with new performances if a site didn’t have any goals set.


Case Study 3: Finding why a redesign has less organic traffic

Quite often, an agency will launch a site redesign only to find out a few weeks later that the organic traffic has plummeted. This can happen for many reasons (a no-index tag is still on live pages, the site has much less content than before, etc). But sometimes, even when the agency did its due diligence and carefully followed all SEO best practices, the traffic can significantly drop (and this is very frustrating). Here’s a way to quickly analyse which pages are problematic, which in turn may help you get to the root cause of the problem.

Find the pages with less organic traffic

We are currently helping this small business site with its SEO. The client redesigned his site a few months ago. Below you can see a before and after screenshot of the generated organic traffic:

drop-compared

The traffic is pretty stable, but since we worked hard to optimize the site, added a lot of content and implemented a link-building campaign, the traffic should be growing instead of remaining at the same level. So we dug further.

The best way to analyze organic traffic is to look at the organic landing page report:

Redesign2

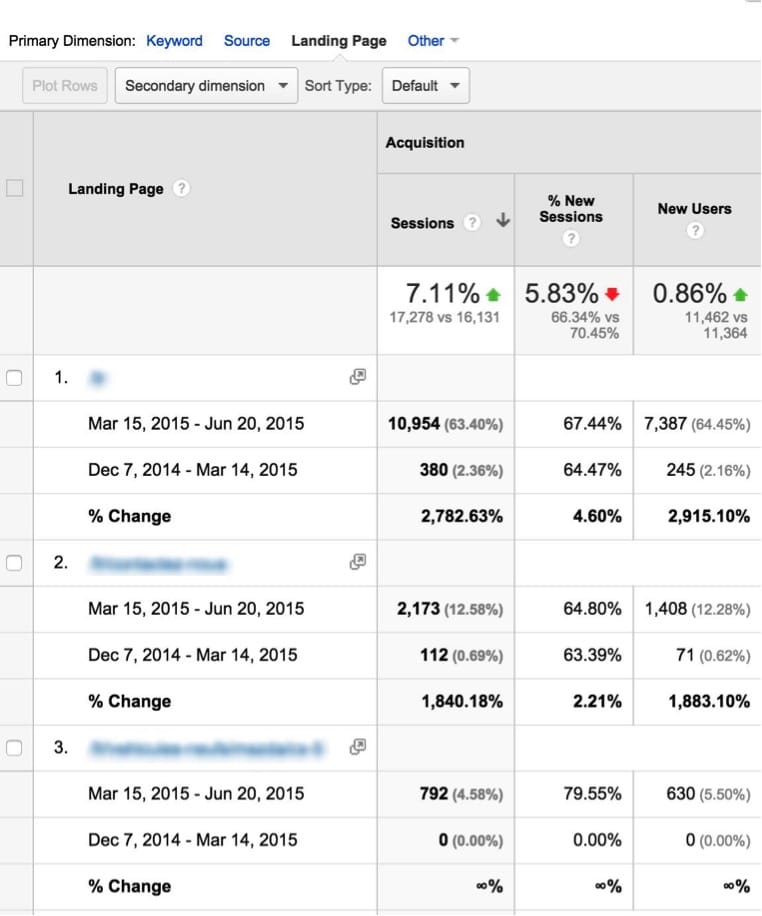
In order to do that in Google Analytics, you simply have to click on “Channel” on the left-hand side menu, then click on “Organic search” and then choose “Landing Page” as the primary dimension.
Redesign2

This is what you’ll see by default (it is called the “Default” Sort Type). It’s not ideal because it only shows you the pages sorted by most traffic for the current period.

What we really want to know is which pages that previously had a lot of organic traffic now don’t. For that, you need to change to Sort Type: “Absolute change” and then click on “Sessions” to sort by the biggest gap from the comparison dates to now:

Redesign2

You now see all the pages that had a lot of traffic before but now don’t.

Finally, it turned out that all the English pages had a rel=“canonical” tag pointing to a specific page, thereby excluding all English pages from Google’s index . They’ve now removed it and the traffic is growing nicely.


Case Study 4: Multichannel funnels

We have an eCommerce client that we are helping with AdWords and SEO. Of course, the main thing the client wants to see is a positive ROI on marketing activities.

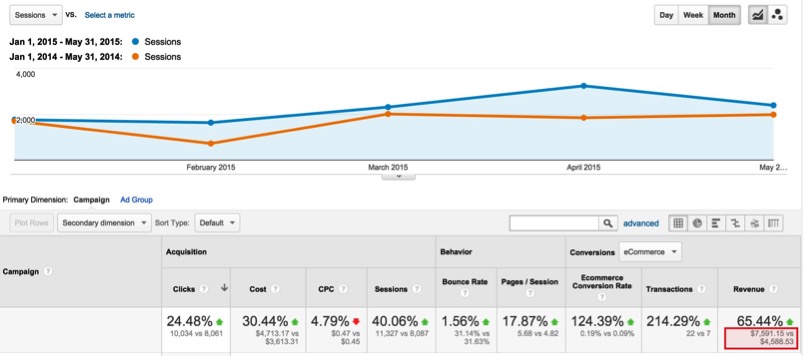
Typically, we could look at the cpc channel (AdWords) and get the generated revenue. Here’s a screenshot below. As you can see, the AdWords campaign generated 7,500$ in sales (with an investment of 4,700$ in AdWords).
Redesign2

If you subtract their profit margin, the client is barely breaking even, at best. But if you only look at paid advertizing from this point of view, it’s usually very hard to be ROI positive. Typically, paid advertising is what we call a first-click medium, meaning it will get potential clients to your site, but they will probably eventually convert from another traffic source…

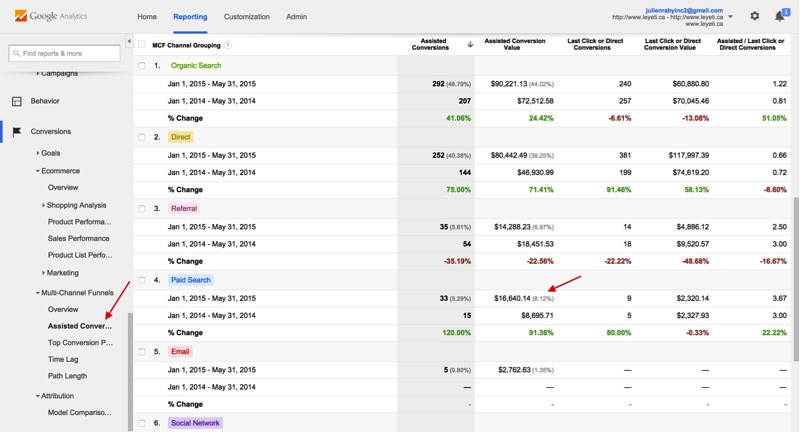
That’s why we like to use a view in Analytics called the “Assisted Conversions”. This works best for eCommerce sites, but you can use it for lead-generating sites as well.
Redesign2

Taking a look at the data from this point of view gives you a completely different picture. You can see that the paid search channel (AdWords) was in fact responsible for over 16,000$ worth of sales + 2000$ in direct sales, which means that for each of these transactions, somewhere in the customer path to purchase there was an AdWords ad involved.

This is a much more realistic way of analyzing your paid advertising performances since the customer very rarely buys on the spot (he shops, compares, try to find deals, etc). But AdWords is a great way to bring potential customers in and analyzing it this way is a much better approach to determine the effectiveness of your paid marketing performances.


Case Study 5: Measure and show the impact of your content marketing efforts

Let’s assume you are helping a client with his content marketing efforts. You may regularly be writing and publishing content on his blog, for example. A few months later, the client wants to measure the impact of this new strategy. Here’s a quick way to do that:

There are two ways we like to present this type of data to our clients: (1) the total number of views on all articles or (2) the number of visitors we attracted to the site with these articles. Either way, the approach is similar.

Analyze the total views on all articles

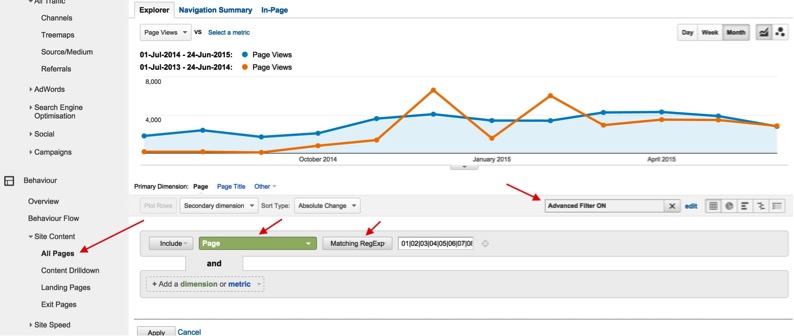
First, you need to go to Behaviour -> Site Content -> All Pages. Then, you need to find a common denominator within the URL of all pages you want to analyze. Sometimes, it’s as easy as using “blog”. In the following example, however, the URLs are segmenting by month, so all articles have a month number in the URL. Here’s how I can get all blog articles:

In Analytics you can segment data with what’s called “regular expressions” in programming. We will use a simple operator called the pipe “|”, which basically means “OR”. So our string will look like this: “01|02|03|04|05|06|07|08|09|10|11|12” (which basically means: Find all URLs that have either “01” or “02” and so on in the URL). You just need to click on “advanced” in the filter box, then select “Matching RegEx” and input the following filter (you will have to adjust the exact filter to find the one that works for you).
Content-marketing1

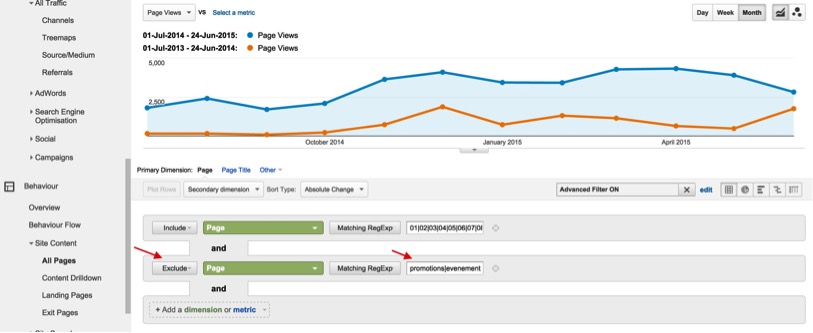
That filter almost did the trick in itself, but it also captured some old pages not related to our content marketing efforts. I found out they all had either “promotions” or “evenements” in them. So we just need to create another excluded filter and filter out these pages using this additional filter: “promotions|evenement”, like this:
Content-marketing2

As you can see in the screenshot above, our efforts are starting to pay off: we started at around 1700 monthly page views and we are now around 4000.


Analyze how many organic visitors were attracted to the site with these articles

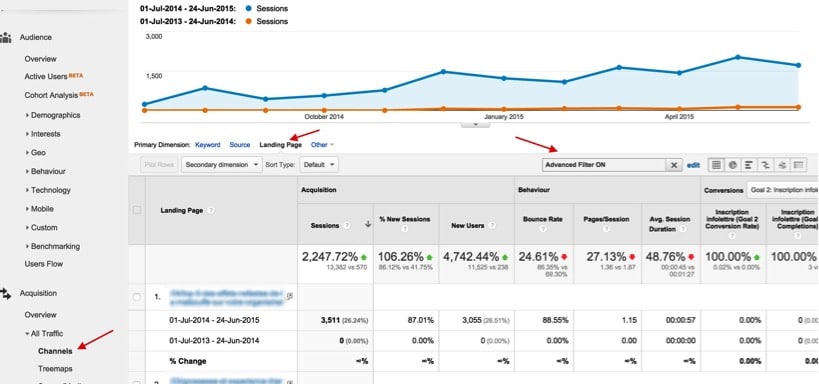
Since content marketing is great for longtail SEO, we want to be able to prove the impact for our clients. You can quickly do this by clicking on Channels -> Organic Search, subsequently choose Primary Dimension: Landing Pages and then apply the same filters than discussed above:
Content-marketing3

The data now reveal that we attract close to 2000 organic visitors per month with our content marketing efforts!

We hope you enjoyed these Google Analytics tips. If you have any other tips/hacks, please share them in the comments below!

Click to rate this post!
[Total: 1 Average: 5]

CONTACT US

    Add Your Heading Text Here

    Lorem ipsum dolor sit amet, consectetur adipiscing elit. Ut elit tellus, luctus nec ullamcorper mattis, pulvinar dapibus leo.

    Rate this
    Click to rate this post!
    [Total: 1 Average: 5]

    2 Responses

    CONTACT US